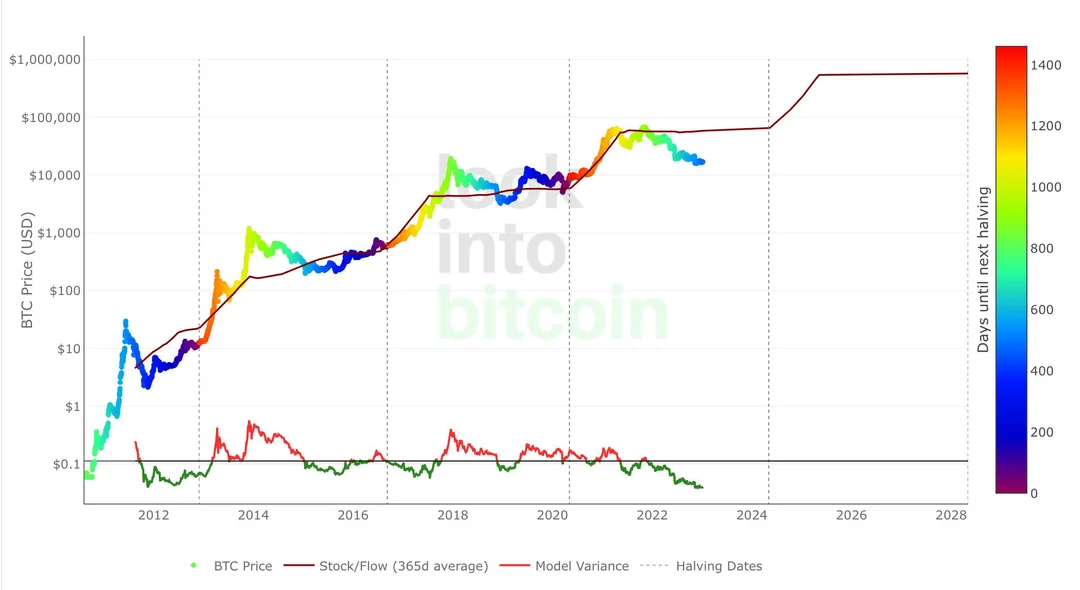
In March 2019, an anonymous Dutch ex-institutional investor publishing under the name PlanB uploaded an essay to Medium titled Modeling Bitcoin’s Value with Scarcity. The essay applied a measure long used in commodity markets — the stock-to-flow ratio, which compares an asset’s existing supply to its annual new production — to bitcoin, and observed that bitcoin’s price had, historically, tracked that ratio with a correlation tight enough to be visually striking when plotted on a logarithmic chart. PlanB drew the chart. The chart began to circulate. It would, for the next two and a half years, become the single most reproduced piece of analytical iconography in bitcoin culture.
The model’s underlying claim was straightforward and seductive. Bitcoin’s stock — the total mined supply — grew predictably with each block. Bitcoin’s flow — annual new issuance — was halved every four years by the protocol’s halving schedule. The ratio of stock to flow therefore increased on a known schedule, and prior to each halving the chart projected a higher price than before. Past data fit; future data, the model suggested, would fit too. The May 2020 halving was projected to push bitcoin toward fifty-five thousand dollars. The 2024 halving was projected to push it toward several hundred thousand. PlanB acquired, over the next year, a Twitter following that would eventually exceed a million people, most of whom encountered bitcoin valuation through the lens of his chart.
The reception was bifurcated. Bitcoin maximalists treated the model as a structural argument for buying — a way of describing scarcity in terms a quantitative investor could engage with. Critics, including a number of professional statisticians and economists, pointed out that the model was, technically, a tautology — market value decomposes to price times stock, and the equation was therefore correlating stock with itself. The criticism was correct. It was also, for several years, ignored. The chart’s predictive power held through the 2020 bull run and into 2021, by which point PlanB was a fixture on every major bitcoin podcast and the model had become a kind of structural argument the community had agreed, collectively, to treat as serious.
The model failed publicly in late 2021. PlanB had publicly committed to declaring stock-to-flow invalidated if bitcoin had not reached one hundred thousand dollars by December 2021. Bitcoin did not. PlanB did not declare the model invalidated. By 2022 the chart’s projected prices had diverged from market reality by an order of magnitude, and a strain of post-S2F bitcoin commentary emerged that treated the model as a useful artifact for an earlier era — one whose function had been, perhaps, less to predict prices than to give a generation of new bitcoiners a defensible-sounding framework for buying when the price was low.
The cultural artifact, distinct from the model’s quantitative claims, is the chart itself. It is among the most reproduced images in bitcoin’s history. It hangs, framed, in offices. It has been printed on T-shirts. Whether or not the line ever resumes its march, the chart belongs to the catalog as a piece of iconography — a visual that, for a window of approximately three years, was how bitcoin’s case for itself was made.